FAOSTAT API in R
To help improve actual evidence bases, here’s a generic tool that I made to access the FAOSTAT API in R. The APi is undocumented as far as I can see. However, there is an unnecessarily complicated R package, but that doesn’t work. This particular example gets population stats for all counties/regions in the world from 1990 to 2021. But you could use it for anything available on the FAOSTAT website.
First, installation (you need to have already installed the packages jsonlite, readr and httr):
install.packages("jsonlite")
install.packages("readr")
install.packages("httr")
Next, load the functions:
get_fao <- function(database_name,areas,elements,items,years) {
  library(jsonlite)
  library(readr)
  library(httr)
	if (length(areas)>1) {areas = paste0(areas, collapse='%2C')}
	if (length(elements)>1) {elements = paste0(elements, collape='%2C')}
	if (length(items)>1) {items = paste0(items, collape='%2C')}
	if (length(years)>1) {years = paste0(years, collapse="%2C")}
	url = paste0("http://fenixservices.fao.org/faostat/api/v1/en/data/",database_name,"?area=",areas,"&area_cs=ISO3&element=",elements,"&element_cs=FAO&item=",items,"&item_cs=FAO&year=",years,"&show_codes=true&show_unit=true&show_flags=true&null_values=false&output_type=csv")
	download <- GET(url)
	translated_download <- content(download, "text")
	df<-read_delim(translated_download, ",", col_names = TRUE)
	return(df)
}
And that’s pretty much it. But you need to know how to get the database names, area codes, element codes and item codes. You can get these from FAOSTAT here, and also if you manually do a FAOSTAT query, they come up in the table on the web.
Here’s an example:
database_name="OA"
data <- fromJSON("https://fenixservices.fao.org/faostat/api/v1/en/definitions/types/area?datasource=DB4",flatten=TRUE)
areas <- as.list(as.data.frame(data$data)$'Country Code')
elements=c(511) #Total population - both sexes
items=c(3010) #Population
years=c(1990:2021)
FAO_data <- get_fao(database_name,areas,elements,items,years)
It might also be handy to download all the items/elements/areas into a a dataframe or list, like I’ve done in the example above for areas. The following code helps with that:
#FAO country codes:
data <- fromJSON("https://fenixservices.fao.org/faostat/api/v1/en/definitions/types/area?datasource=DB4",flatten=TRUE)
FAO_country_codes <- as.data.frame(data$data)
#FAO element codes:
data <- fromJSON("https://fenixservices.fao.org/faostat/api/v1/en/definitions/types/element?datasource=DB4")
FAO_element_codes <- as.data.frame(data$data)
#FAO item codes:
data <- fromJSON("https://fenixservices.fao.org/faostat/api/v1/en/definitions/types/item?datasource=DB4")
FAO_item_codes <- as.data.frame(data$data)
#FAO database names:
data <- fromJSON("https://fenixservices.fao.org/faostat/api/v1/en/definitions/types/item?datasource=DB4")
FAO_item_codes <- as.data.frame(data$data)
database_names <- FAO_item_codes[c('Domain Code', 'Domain')]
database_names <- unique(database_names)
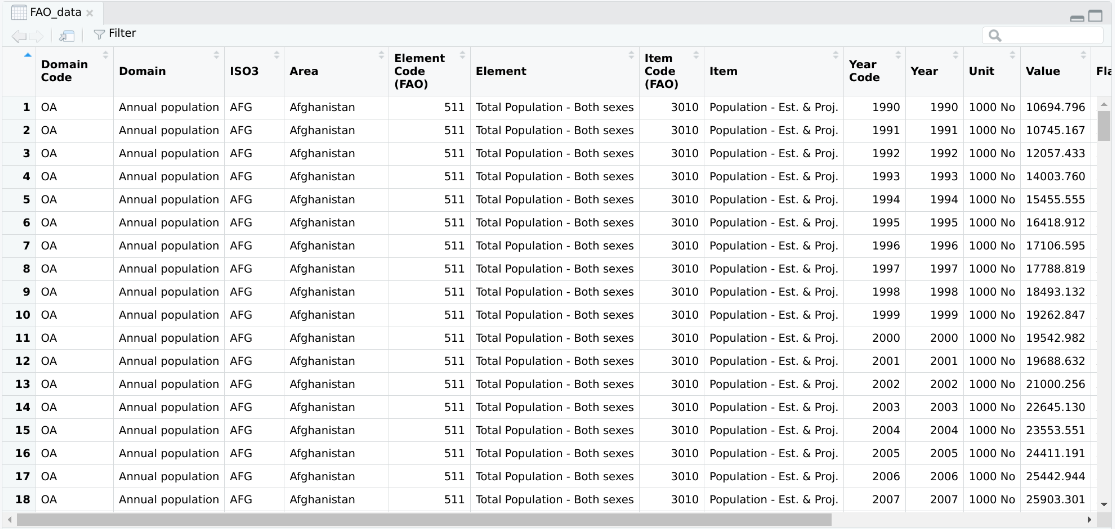
Here’s an example of the output for this example - all population for all areas: